
Photometric RedshiftsAs described in the DR5 paper, the SDSS makes available the results of two different photometric redshift determinations for galaxies, one based on neural nets and the other based on a template-fitting approach. With DR7.Photometric Redshifts with Neural NetsThe neural net solutions for photometric redshifts and their errors (listed as Photoz2 in the CAS, and described in Oyaizu et al. 2008) have not changed since DR6, and do not use the ubercalibrated magnitudes. However, we now provide a value-added catalog containing the redshift probability distribution for each galaxy, p(z), calculated using the weights method presented in Cunha et al. (2008). The p(z) for each galaxy in the catalog is the weighted distribution of the spectroscopic redshifts of the 100 nearest training-set galaxies in the space of dereddened model colors and r magnitude. For the p(z) calculation we also added the zCOSMOS (Lilly et al. 2007) and DEEP2-EGS (Davis et al. 2007) galaxies to the spectroscopic training set used for the Photoz2 solution. Cunha et al. (2008) showed that summing the p(z) for a sample of galaxies yields a better estimation of their true redshift distribution than that of the individual photometric redshifts. Mandelbaum et al. (2008) found that this gives significantly smaller photometric lensing calibration bias than the use of a single photometric redshift estimate for each galaxy. Photometric Redshifts: A New Hybrid TechniqueWith DR7, we have made substantial improvements in the other photometric redshift code (Photoz), using a hybrid method that combines the template fitting approach of Csabai et al. (2003); i.e., the approach used in DR5 and DR6, and an empirical calibration using objects with both observed colors and spectroscopic redshifts. We summarize the method briefly here, with details to follow in a paper in preparation. The spectroscopic sample of SDSS contains over 900,000 spectroscopically confirmed galaxies, and the combination of the main sample (Strauss et al. 2001), the LRG sample (Eisenstein et al. 2001) and special plates targeted at fainter blue galaxies (DR4 paper) more or less cover the whole color region in which galaxies lie to the depths of SDSS. Thus we use the DR7 spectroscopic set as a reference set for redshift estimation without any additional data from synthetic spectra. The estimation method uses a k-d tree (following Csabai et al. 2007) to search in the ubercalibrated u-g, g-r, r-i, i-z color space for the 100 nearest neighbors of every object in the estimation set (i.e. the galaxies for which we want to estimate redshift) and then estimates redshift by fitting a local hyperplane to these points, after rejecting outliers. If an object lies outside the bounding box of the 100 nearest neighbors in color space, the photometric redshift is less reliable, and the object is flagged accordingly. We use template fitting to estimate the K-correction, distance modulus, absolute magnitudes, rest frame colors, and spectral type. We search for the best match of the measured colors and the synthetic colors calculated from repaired (Budavari et al. 2000) empirical template spectra at the redshift given by the local nearest neighbor fit. We have found that the mean deviations of the redshifts from the best-fit hyperplane is a good estimate of the error. That, together with the flag indicating whether an object lies outside the bounding box of its neighbors, and the difference between the estimated photometric redshift and the average redshift of its neighbors, can be used to select objects with reliable photometric redshift values. The rms error of the redshift estimation for the reference set decreases from 0.044 in DR6 to 0.025 in DR7 with this improved algorithm: 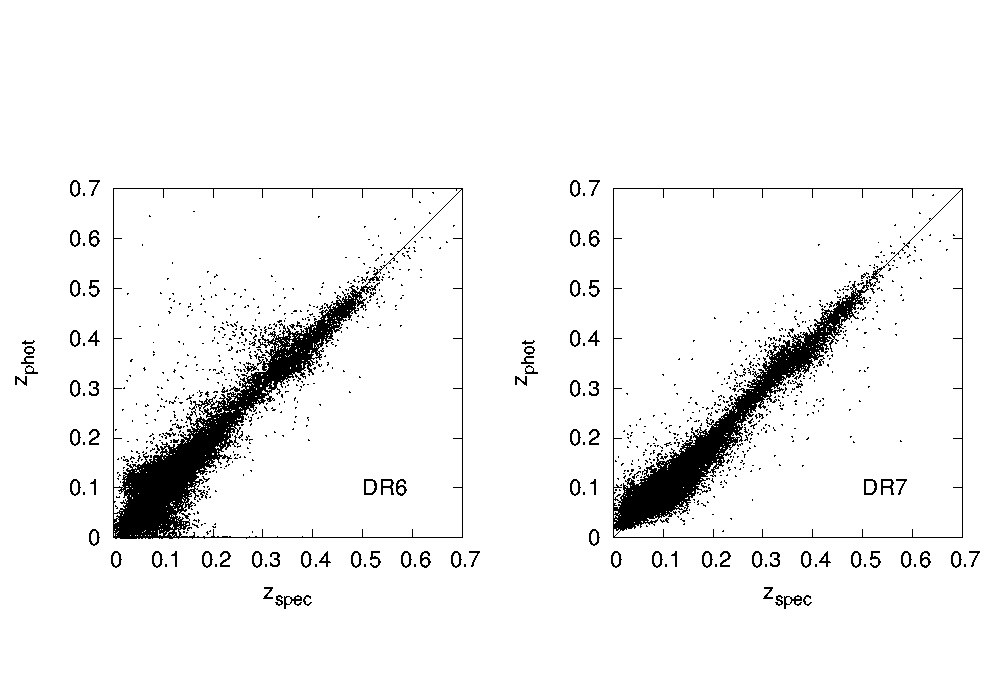 The template-based estimated redshifts versus the true spectroscopic redshifts for a random sample of 30,000 galaxies with redshifts from SDSS. The estimated values calculated with the old (DR6) method has significantly larger scatter and more outliers than the ones with the new hybrid (DR7) technique. Note that the sample is dominated by red galaxies (whose photometric redshifts are intrinsically easier to measure) at z > 0.2. Iteratively removing the outliers beyond 3 σ gives rms errors of 0.028 and 0.020 for the old and new methods, respectively. In addition, the reliability of the quoted errors is much higher. *Text and figures on this page come from an author-created, un-copyedited version of the SDSS Data Release 7 paper, an article submitted to Astrophysical Journal Supplements. IOP Publishing Ltd is not responsible for any errors or omissions in this version of the manuscript or any version derived from it. A preprint of the DR7 paper is available from the arXiv preprint server. Last modified: Tue Apr 15 12:00:12 CDT 2003 |